U.S. Adolescent Cancer Rates are Increasing
During recent analysis of U.S. epidemiology data that spans 1973 to 2013 and correlation of cumulative cancer diagnoses by year of birth with cumulative DNA damage, we observed a variable trend of increasing diagnosis rates that starts in the mid-1980s, increases in rate in the 1990s, and only starts to slow near 2010 [1]. Since cancer diagnoses are relatively rare in children, an increase in adolescent diagnosis rates may be overlooked when looking at diagnosis rates of the entire population. Similarly, methodologies that bin different ages and years of birth obfuscate changes in rates of cancer diagnosis. Intrigued, we attempted to identify any environmental variables that could explain this substantial increase in cancer diagnosis rates of U.S. adolescents. A significant environmental change would seem to be required to have such a dramatic adverse change on diagnosis rates. Coincidentally, a recent survey of 153 cancer registries confirms that childhood cancer diagnoses have increased throughout the world since the 1980s with the exception of sub-Saharan Africa [2].
Epidemiology data from the National Cancer Institute was utilized for the U.S. population from 1973 to 2013 [1]. This clinical data has birth and diagnosis dates temporally truncated to the year to protect the identity of individuals, which precludes sub-annual analysis. Live birth totals for males and females in the U.S. were utilized from vital statistics reports for each year from 1973 through 2013 to provide a population model for clinical data [3,4,5,6]. (See U.S. Live Births data.) Cumulative diagnoses of cancer were calculated for each year of birth from 1973 to 2013 for each year of age up to ten. Live birth totals from vital statistics were utilized to calculate diagnoses rates per million live births. (See Table 1.)
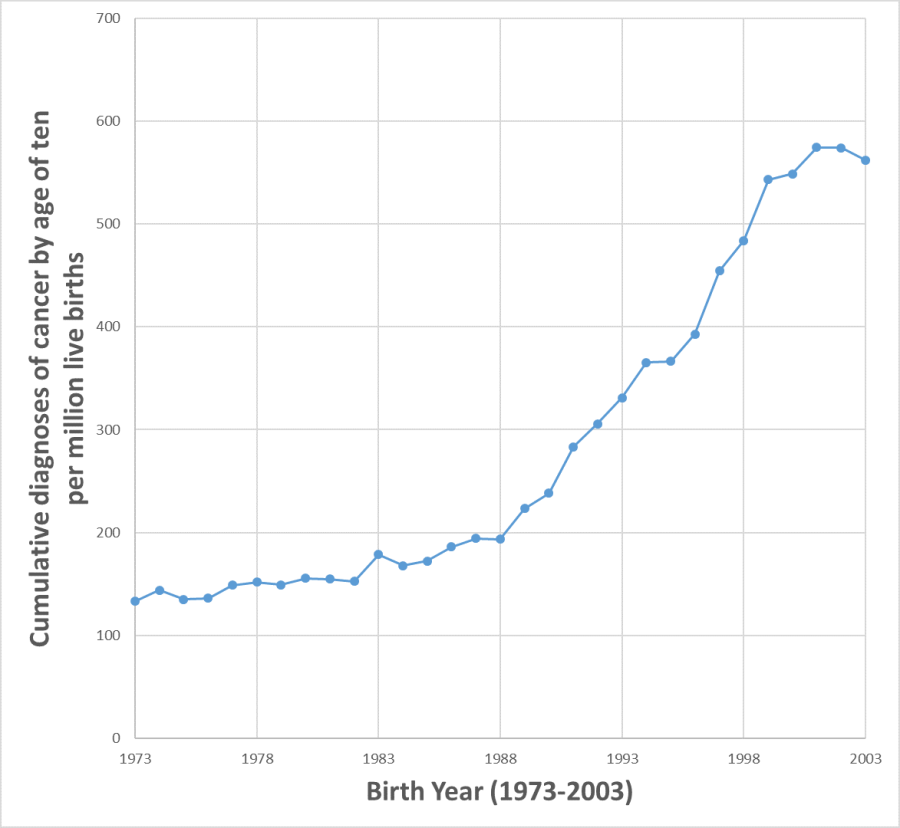
During this period, there was a substantial increase of cancer diagnosis rates in adolescents (Fig. 1), increasing from 132.9 diagnoses per million live births in 1973 by the age of ten (i.e., through 1983), to 562.4 diagnoses per million live births in 2003 by the age of ten (i.e., through 2013). This represents an overall 323% increase of diagnosis rates. By 1985, the diagnosis rate increased 29% to 167.9. In four short years, by 1989 the diagnosis rate had increased to 68% to 223.5. Over the next ten years, through 1999, the rate increased nearly 23% per year, to 543.3. The rate of increase appears to slow after 2000, rising to 562.4 in 2003 (for diagnoses in ten-year-olds through 2013).
Table 1: Cumulative number of cancer diagnoses by age ten per million live births (1973-2013)
|
Year of Birth |
Diagnoses |
|
|
1973 |
132.9 |
|
|
1974 |
144.0 |
|
|
1975 |
134.9 |
|
|
1976 |
136.1 |
|
|
1977 |
148.8 |
|
|
1978 |
151.8 |
|
|
1979 |
149.1 |
|
|
1980 |
155.6 |
|
|
1981 |
154.9 |
|
|
1982 |
152.4 |
|
|
1983 |
178.6 |
|
|
1984 |
167.9 |
|
|
1985 |
172.0 |
|
|
1986 |
186.1 |
|
|
1987 |
194.3 |
|
|
1988 |
193.6 |
|
|
1989 |
223.5 |
|
|
1990 |
238.3 |
|
|
1991 |
283.4 |
|
|
1992 |
305.5 |
|
|
1993 |
331.2 |
|
|
1994 |
365.3 |
|
|
1995 |
366.4 |
|
|
1996 |
392.9 |
|
|
1997 |
454.5 |
|
|
1998 |
483.8 |
|
|
1999 |
543.3 |
|
|
2000 |
548.7 |
|
|
2001 |
574.5 |
|
|
2002 |
574.1 |
|
|
2003 |
562.4 |
|
[1] Surveillance, Epidemiology, and End Results (SEER) Program Research Data (1973-2013), National Cancer Institute, DCCPS, Surveillance Research Program, Surveillance Systems Branch, released April 2016, based on the November 2015 submission.
[2] Steliarova-Foucher, E, et al., International incidence of childhood cancer, 2001-10: a population-based registry study, The Lancet Oncology (2017).
[3] National Vital Statistics Reports, Vol 47, Number 18, Births: Final Data for 1997, dated 29 Apr. 1999, by Stephanie J. Ventura, et. al., US Dept. of Health & Human Services, CDC and Prevention, National Center for Health Statistics, National Vital Statistics System.
[4] National Vital Statistics Reports, Vol 53, Number 10, Trend Analysis of the Sex Ratio at Birth in the United States, dated 14 June 2005, by T.S. Matthews and Brady E. Hamilton, US Dept. of Health & Human Services, CDC and Prevention, National Center for Health Statistics, National Vital Statistics System.
[5] National Vital Statistics Reports, Vol 57, Number 7, Births: Final Data for 2006, dated 7 Jan. 2009, by Joyce A. Martin, et. al., US Dept. of Health & Human Services, CDC and Prevention, National Center for Health Statistics, National Vital Statistics System.
[6] National Vital Statistics Reports, Vol 64, Number 1, Births: Final Data for 2013, dated 15 Jan. 2015, by Joyce A. Martin, et. al., US Dept. of Health & Human Services, CDC and Prevention, National Center for Health Statistics, National Vital Statistics System.